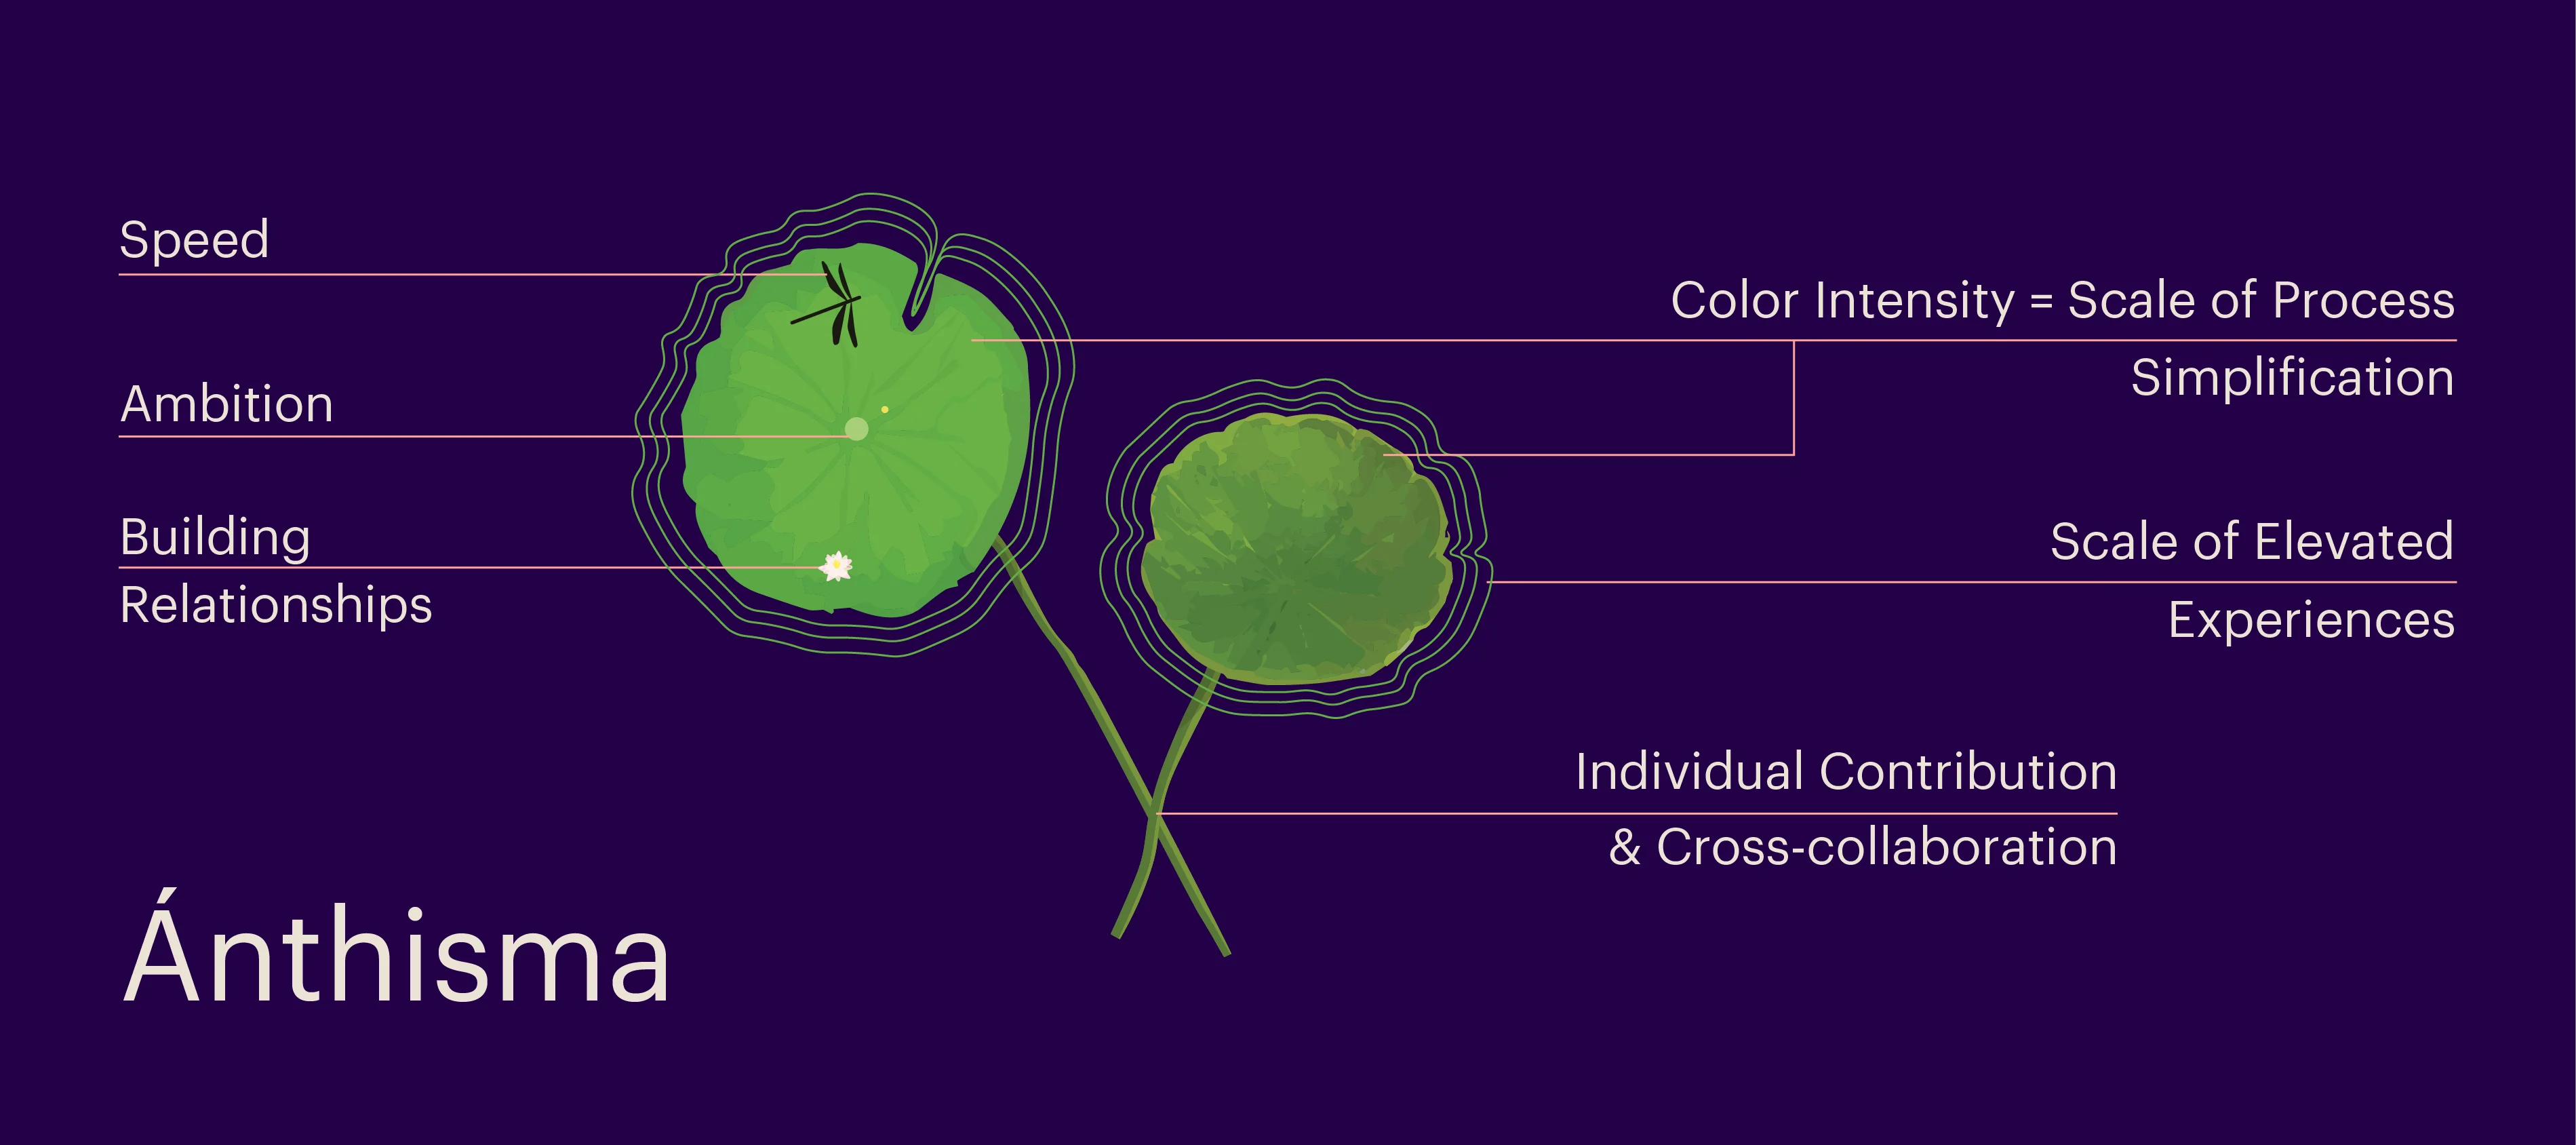
For MathCo.’s 5-year anniversary, Gomathy Viswanathan, Associate, TheMathCompany created a data visualization that represented the organization, its growth journey and its people. Working with Meena Priya S, Senior Associate, TheMathCompany, the duo created a picturesque data visualization, titled Ánthisma.
A deep dive into the genesis of Ánthisma:
Gomathy shares that her experience in the analytics industry, having had various opportunities to work closely with various clients, create multiple executive dashboards, a super cool Power BI escape Room [1], has also helped her appreciate the importance of good design. She shares, “I have learnt to specifically hone my skills on information design and leverage that as a powerful medium to tell data stories. And Ánthisma was one such data story that I am elated to have gotten the opportunity to tell.
It all started with the fundamental themes and principles that guide the MathCo way of working: MathCo BASICS. Each letter in BASICS stands for a pivotal value that all folks at MathCo. imbibe in their day to day life at work – Building Relationships, Ambition & Hunger, Simplicity, Individuals Matter, Creating Elevated Experiences and Speed. From my perspective, I looked at this articulation as an opportunity to also showcase how these translate into a representation of who we are. And I wanted to represent MathCo and it’s intrinsic bond with these values and look at how these varied patterns shape our work life every single day. Working with Meena Priya and other folks from the marketing team, thus was born, Ánthisma, an artistic data visualization to showcase results from a survey about how employees connected with our company values.”
It’s all in the details:
“If there was one thing we were certain about from the beginning of creating this visualization, it was its level of detail,” shares Gomathy. “At MathCo, the work we do simplifies decisions for leading enterprises – we show aggregations, regression lines but the humans we work with have their own unique individualities, views, opinions, and thoughts on different aspects. Therefore, we wanted to create something meaningful that represented every single individual with this work of art,” she elaborates.
Before delving into Gomathy’s hypotheses on the visualization, here’s a quick overview of the six themes and what they stand for.
What is MathCo BASICS?
MathC. BASICS refers to the fundamental principles behind all our thoughts, decisions and actions.
Building Relationships – We want to build deep relationships with our customers so that they see us as true partners, and with out people, create a holistic work culture where everyone feels like they belong.
Ambition and Hunger – Ambition and hunger drive us to do more in every endeavor we undertake – be it in where we want to go as a company or what we want to achieve in our careers as individuals.
Simplicity – We think deeply about how we can simplify the most complex solutions and are constantly working towards becoming the world’s best problem-solvers.
Individuals Matter – This idea is core to us. Whether they are clients who have their multiple challenges, or our people who have their own goals, ambitions, and needs, every individual is special.
Creating Elevated Experiences – The elevated experience we create for our clients has led to them wanting to work with us again. Similarly, we strive to ensure that the experiences we provide to employees, at various touchpoints in the organization, are elevated in thought and action.
Speed – While we have the patience to reach the ultimate end goal, the need for speed is real – be it in using the tech and expertise at our disposal to get things done for our customers, or to ensure that org-wide operations take place seamlessly and swiftly.


How the themes connect to the visualization:
The visual is all about the people of MathCo. and their relations with their world of work and the peers that work in it with them. When analyzing, Gomathy’s first assumption was that the more time that people spend in the organization, the more inclined are they to the organization’s themes and values. “But the discovery we made was fascinating – the median scores were found to be the same across all years, meaning that we’ve managed to embody who we are really well, not just for existing employees but also for newer members of the MathCo. family.”
And here’s what that culture reflected.
A big contributor to MathCo.’s success, at the core of which are the people, is the ability to collaborate, communicate and build winning solutions through strong collaborations. And the visualization helped bring to light the extent to which each employee appreciates one and another’s strengths and differences and uses them to collaborate better.
The survey results also showcased how much MathCo. employees value individual and collective ambitions. “Not just that,” explains Gomathy, adding, “The org-wide nature of ensuring that innovative and top-notch quality work is appreciated, has helped nurture and maintain high standards of ambition.” People’s ability to successfully collaborate internally and externally, also helped simplify complex information, processes and ways of working, thereby, ensuring that every task was undertaken and completed in the best possible way. This work culture helps create elevated experiences not just for clients but also for employees.
Additionally, the data also brought to the fore the level of importance that each individual placed on the need for speed. “It was surprising and amazing to find that people who do things at speed did so without losing sight of how important simplification of complex algorithms and frameworks is,” explains Gomathy.
In conclusion, sharing that all the correlations mentioned above are her hypotheses, and her assumptions and guesses are based on causal relationships, Gomathy concludes that “The only way to understand how these themes work together is to ask these questions to ourselves and identify what we as individuals relate to the most, and what drives each of us in our world of work. This visualization is just an overview of the firm’s journey so far and at its core, it is a celebration of all of our people’s relentless efforts, hard work, and ambition to achieve incredible milestones.Therefore, to simply put it, Ánthisma, celebrates each and every member of the MathCo. family. And it celebrates the beautiful experience of turning numbers into art!”
