What is Causal Inference?
Suppose a fashion retail company takes out a promotional discount offer during a weekend and sees a considerable increase in sales that weekend. Should they celebrate the success of the promotional campaign which led to all that increased sales? Or should they pause to learn whether the uptick in sales was truly because of the offer or due to the festive season that weekend?
Let’s take another example. There are two restaurants, A’s Pizzas and B Pizzeria, which sell similar kinds of pizza. B Pizzeria sells 100 pizzas per day, while A’s Pizzas, located in a busy part of town with a lot of people crossing it, sells 500 pizzas per day. One day, A’s Pizzas decides to drop its prices by 5%. After this, we notice that A starts selling 1000 pizzas per day, and B starts selling 200 pizzas per day. Did the price drop by A lead to a drastic difference in sales, of 800 pizzas per day, between the two stores?
The answer to both questions is not simple. To answer these kinds of business questions, we would need to conduct randomized controlled trials to establish a cause-and-effect relationship. In the first example, it could have taken the form of the fashion retailer rolling out the offer in some stores while keeping prices unchanged in other comparable stores on the same weekend to measure the effect of promotions. However, conducting such elaborate experiments can be expensive and is often not feasible. Therefore, in cases such as these, we often analyze after-the-fact observational data to find out whether a particular strategy (a promotional offer or a price drop in our examples) led to an increase in sales.
As data scientists, we’re interested in how to train a machine to understand such cause-and-effect relationships and help establish what is called ‘causal inference’. In the subsequent sections of this article, we explain the core concepts behind causal inference and its applications in the business setting.
Causal Modeling in Machine Learning
While machine learning techniques do a great job at predicting an outcome, they do not (yet) answer the why behind the predictions. Explainable AI techniques like SHAP and LIME have become popular choices to bring transparency into these predictions. However, they are post-hoc explanations of the ML model—i.e., their purpose is to explain the correlations detected by the ML model (often by creating another model for the explanation). Causal models, on the other hand, are purpose-built to discover causality and answer causal questions.
Logic Behind Causal Inference: Counterfactual Analysis
Causal modeling deals with the problem of estimating counterfactuals. Let’s consider a situation where an e-commerce company wants to run an email campaign to boost the purchase of its products, and then find out how much of the purchase was caused by the email campaign. In causal modeling jargon, the promotional email is the ‘treatment’, and the purchase is the ‘outcome’. Our objective is to estimate the effect of treatment on the outcome.
In the absence of randomized controlled trials (A/B testing), we can estimate the causal effect of emails on customer purchases using observational data about customers.
Causal effect = purchase value if email sent – purchase value without sending email
This needs to be calculated for each customer, and then the effect is aggregated across all customers. However, the challenge here is that for any given customer, only one of the purchase values is observed—as illustrated in Table 1, where the numbers highlighted in orange are not observed.
A potential solution is to impute this missing data in orange based on how much similar customers have purchased and then derive the causal effect. Causal inference frameworks provide various methods to address these challenges and answer causal questions.
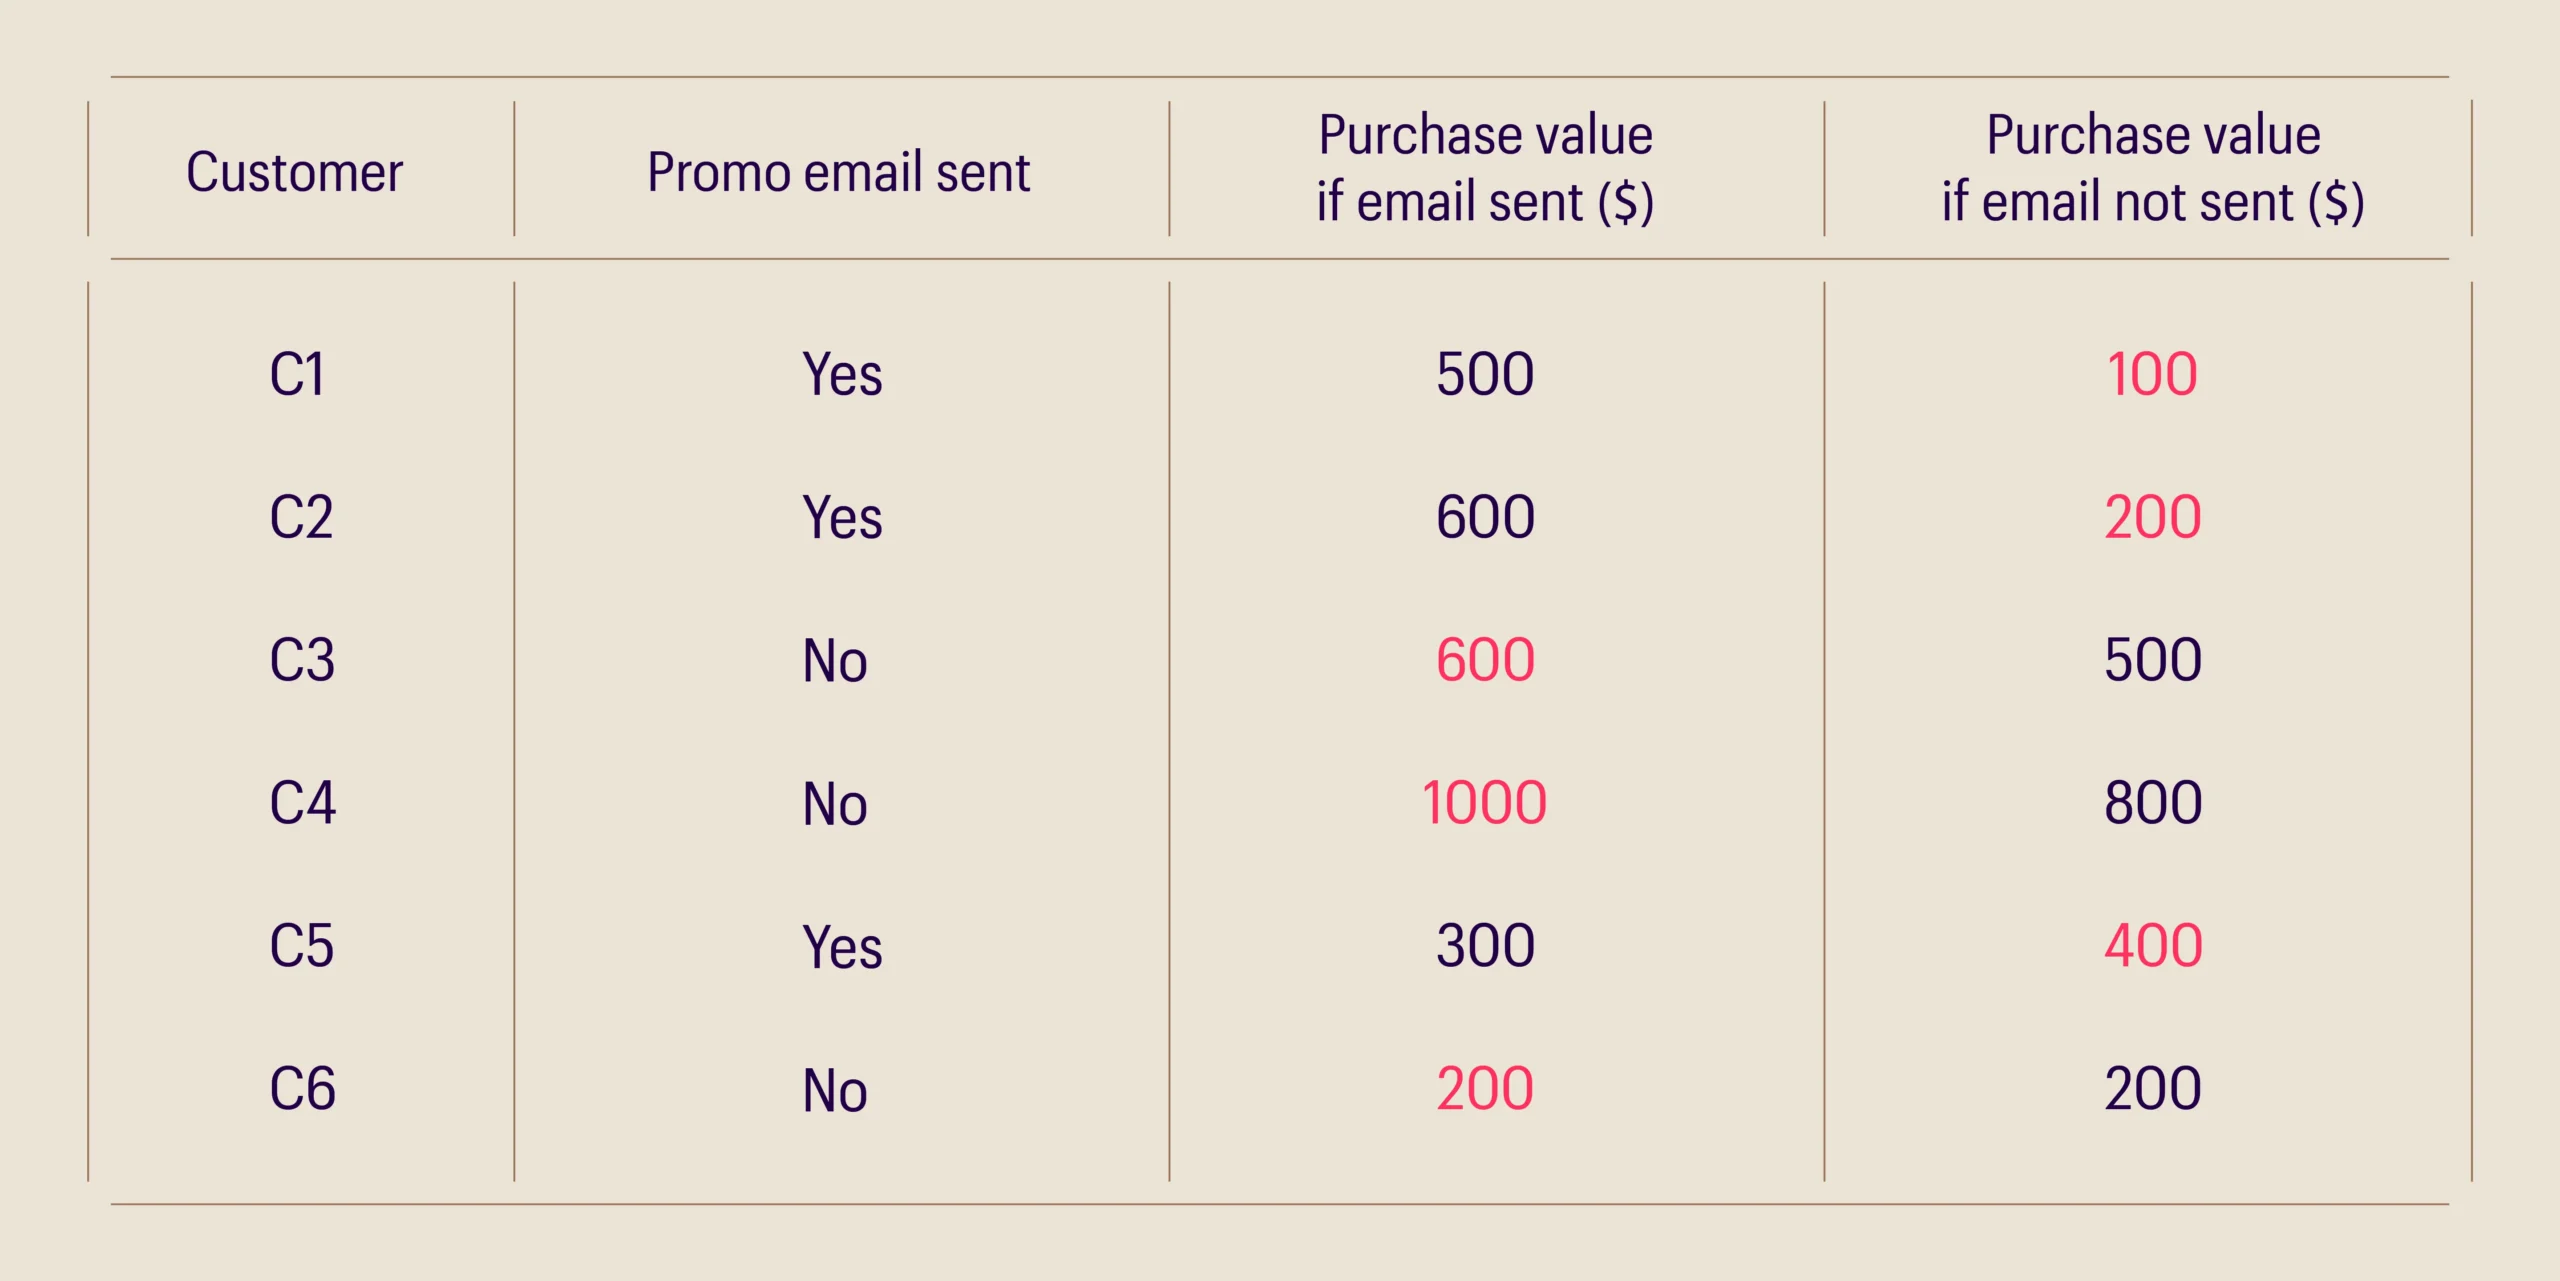
Table 1: Numbers in orange color indicate unseen outcomes.
Understanding causal inference concepts
Before getting to the process, let’s first understand a few basic concepts with the help of examples.
Directed Acyclic Graph (DAG):
A directed acyclic graph (DAG) provides a visual representation of the causal relationship among a set of variables. Causal models usually take the DAG as a starting point and estimate causal effects in the graph.
The DAG should be carefully constructed with multiple viewpoints from subject matter experts, as this will determine the rest of the causal modeling process. It is important to note that a DAG may not always represent the true nature of the causal relationships, but it is a framework to explicitly declare our hypothesis about those relationships. A single problem, if highly complex, can have multiple DAGs. While there are algorithms that can help discover the causal structure, they just represent one possibility of the true DAG. Determining the causal structure for real world problems can be challenging. This is why incorporating domain knowledge into the causal modeling process is crucial.
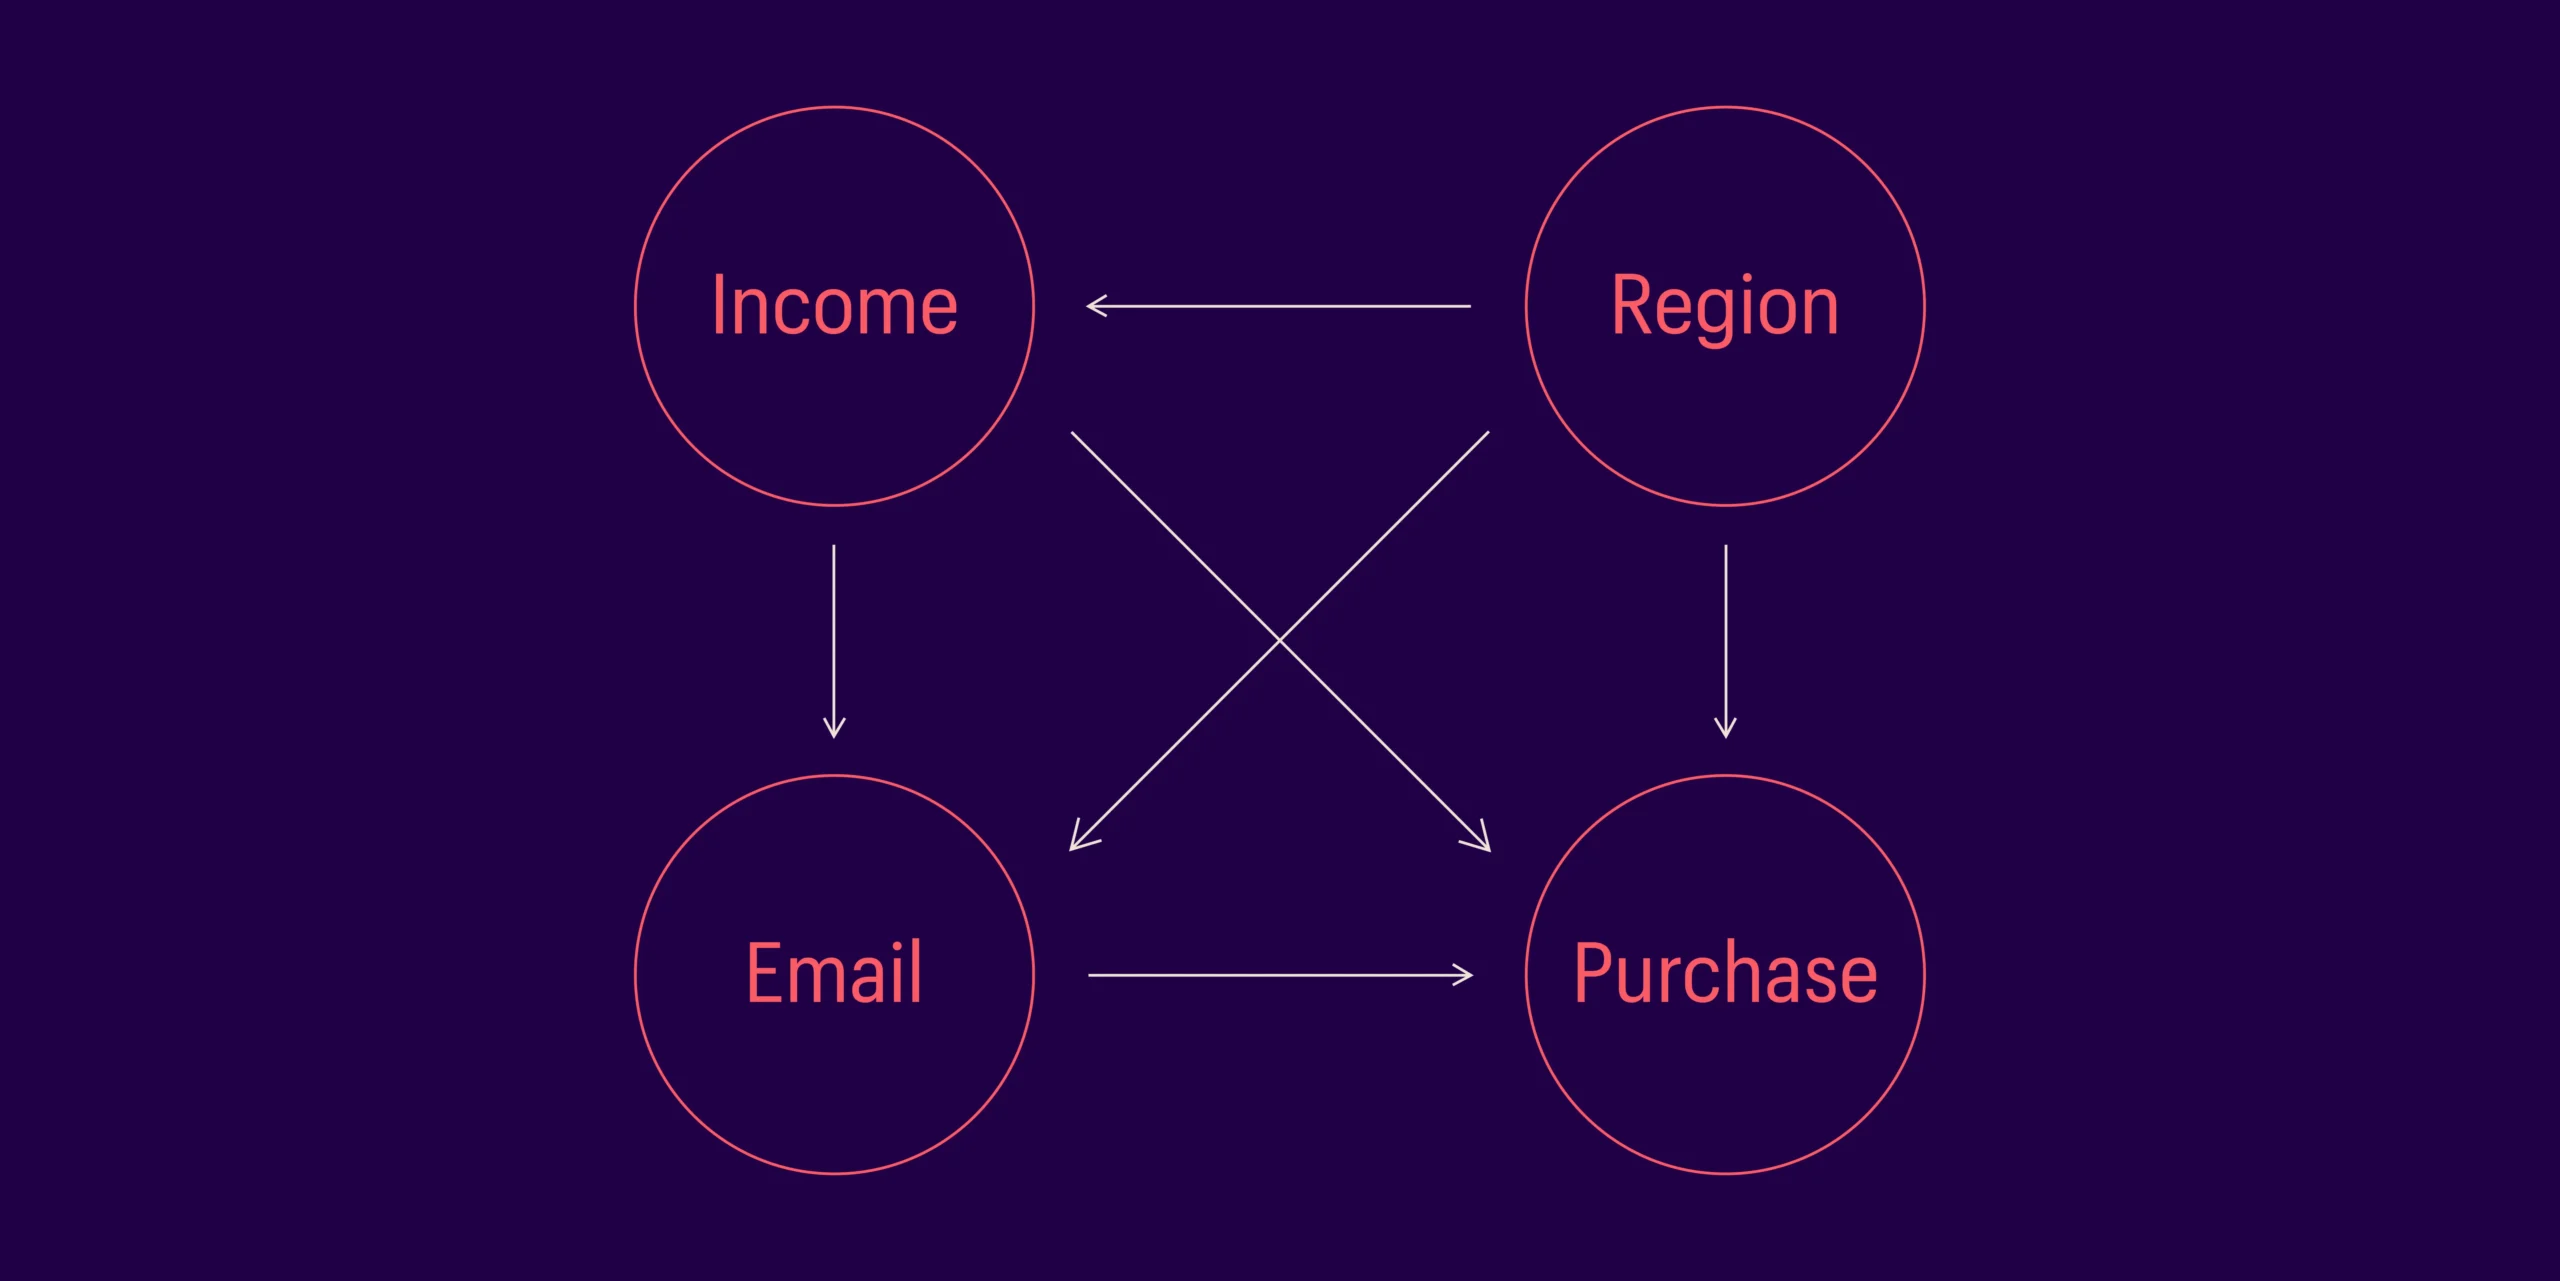
Fig1: – Illustrative DAG
Confounders:
A key challenge in estimating the causal effect of any treatment is the effect of confounders on both the treatment and the outcome. A variable is called a confounder if it predicts both treatment and outcome. In the email campaign example earlier, what if the e-commerce company sent emails to high-income customers, and high-income customers also purchase more? In this scenario, income is the confounder that will make it challenging to estimate the true effect of treatment (email) on outcome (purchase). (Explained in Figure 2).
Loosely put, causal inference frameworks estimate the causal effect by removing all connections to the treatment, keeping everything else the same. As explained in Figure 3, a causal model can remove the confounding effect of income and then estimate the causal effect of email on purchase.
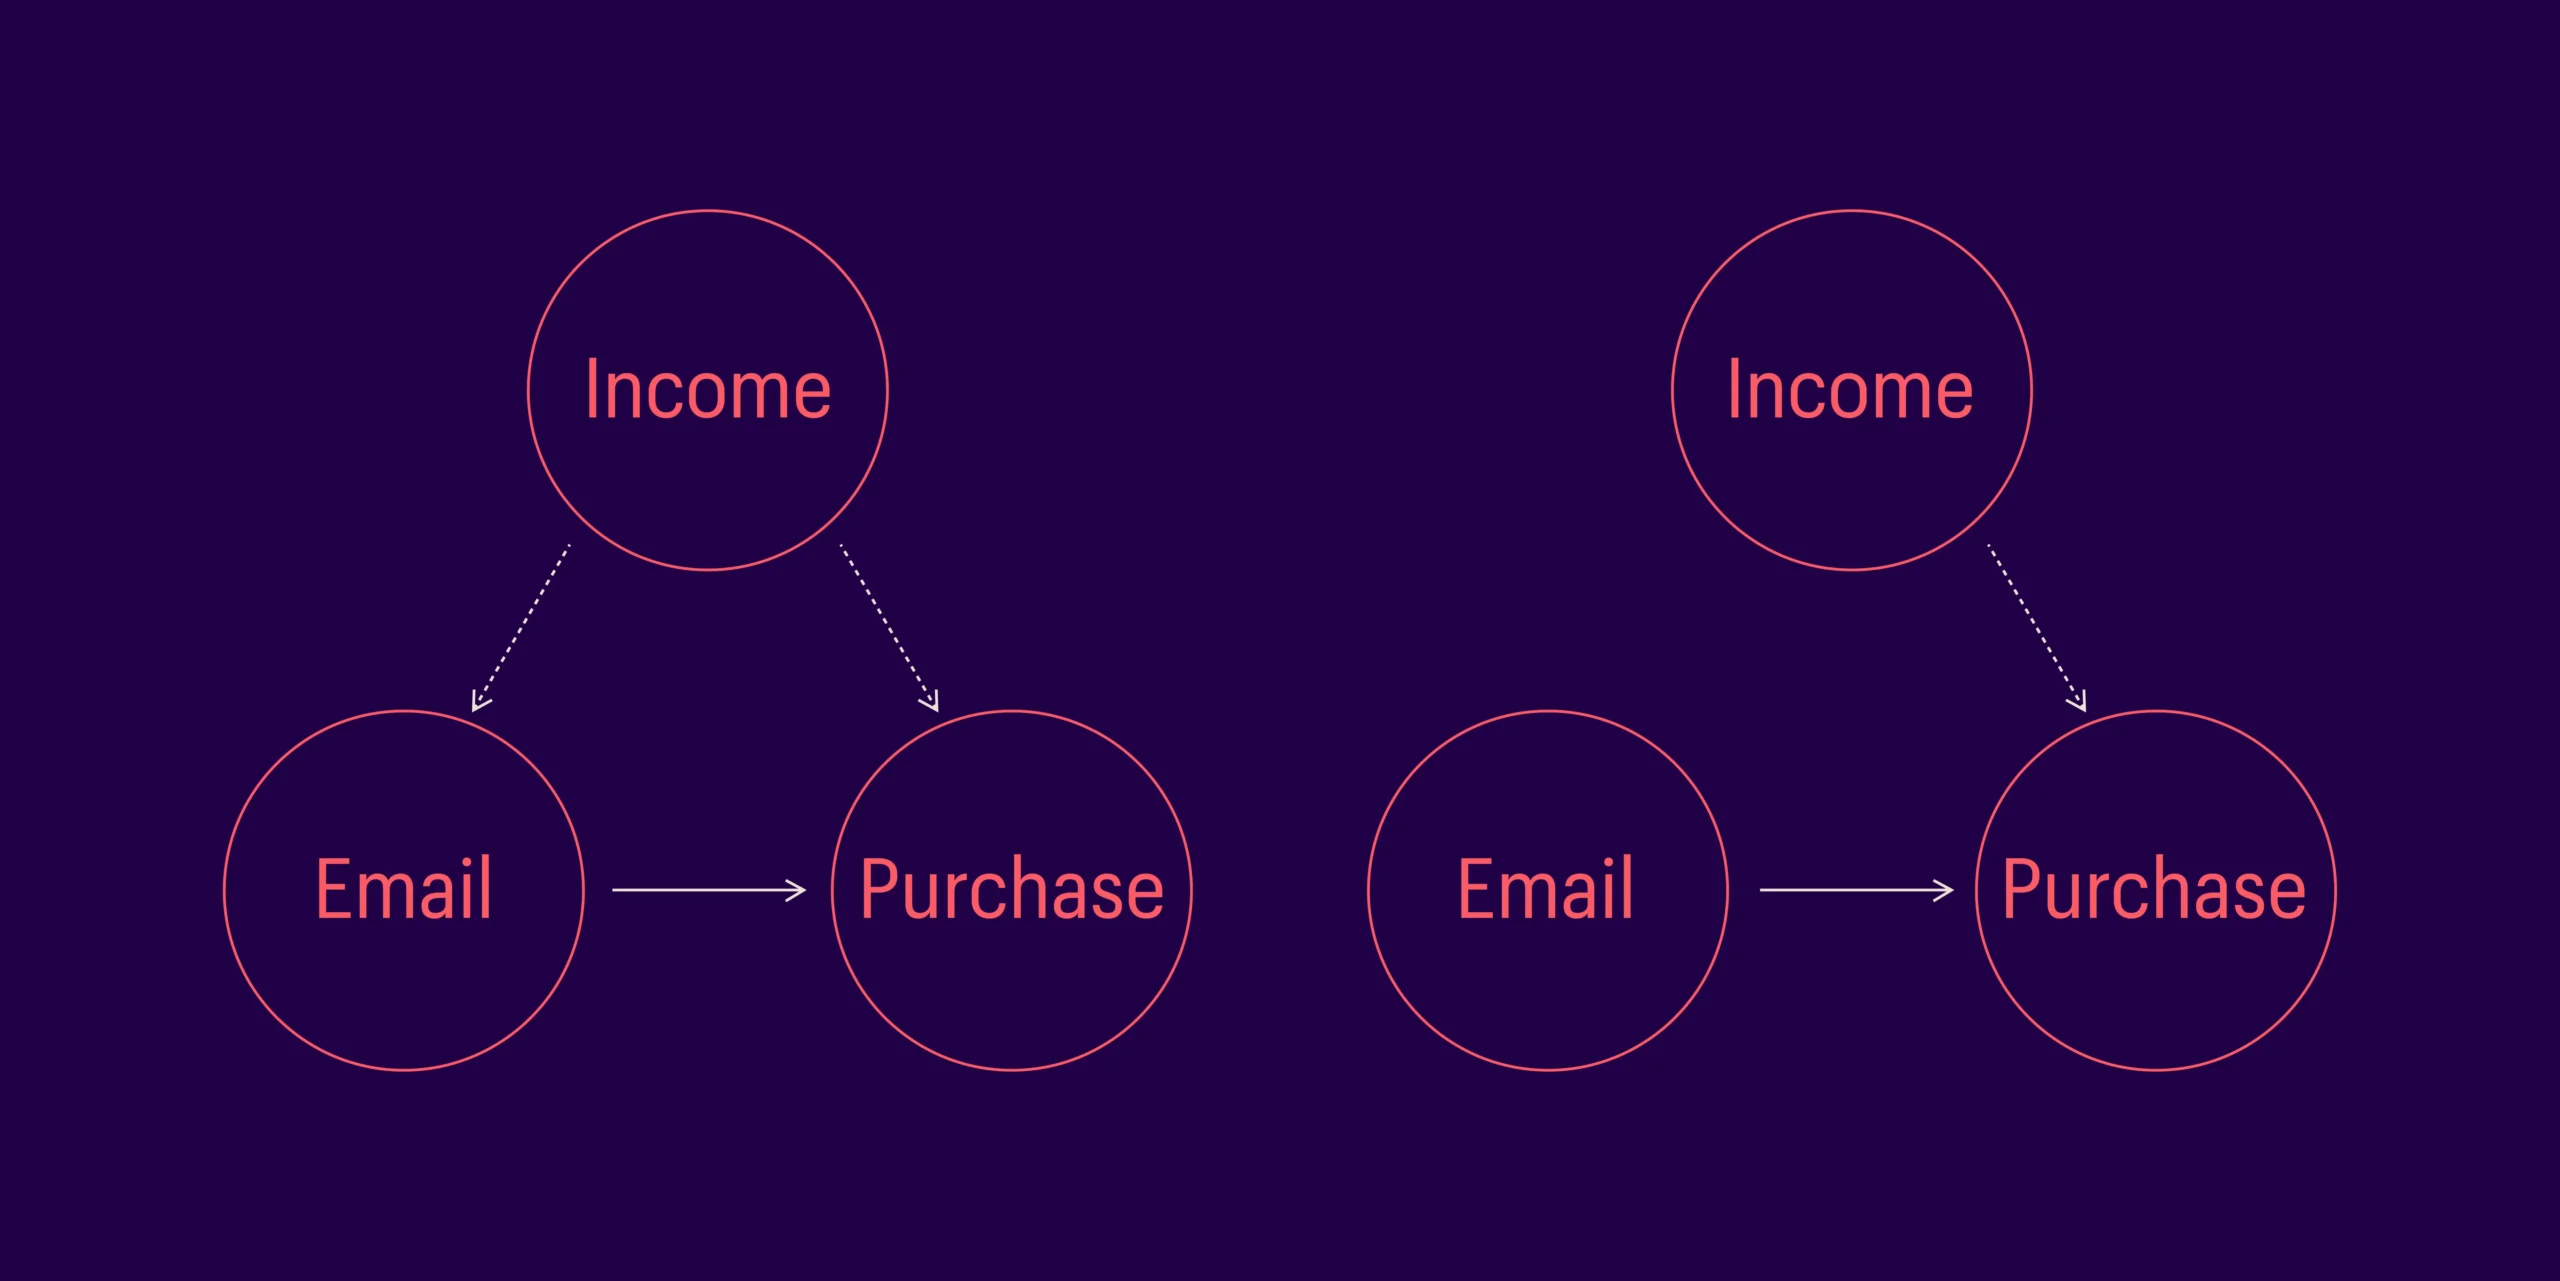
Fig2. Income is the confounder that makes it challenging to estimate the causal effect of email on purchases
Fig3. Causal model estimates the impact of treatment on outcome by removing the confounding effect
Matching:
The example in Table 2 shows two sets of customers and their purchase values: a) customers who were sent promo emails, and b) customers who were not sent promo emails.
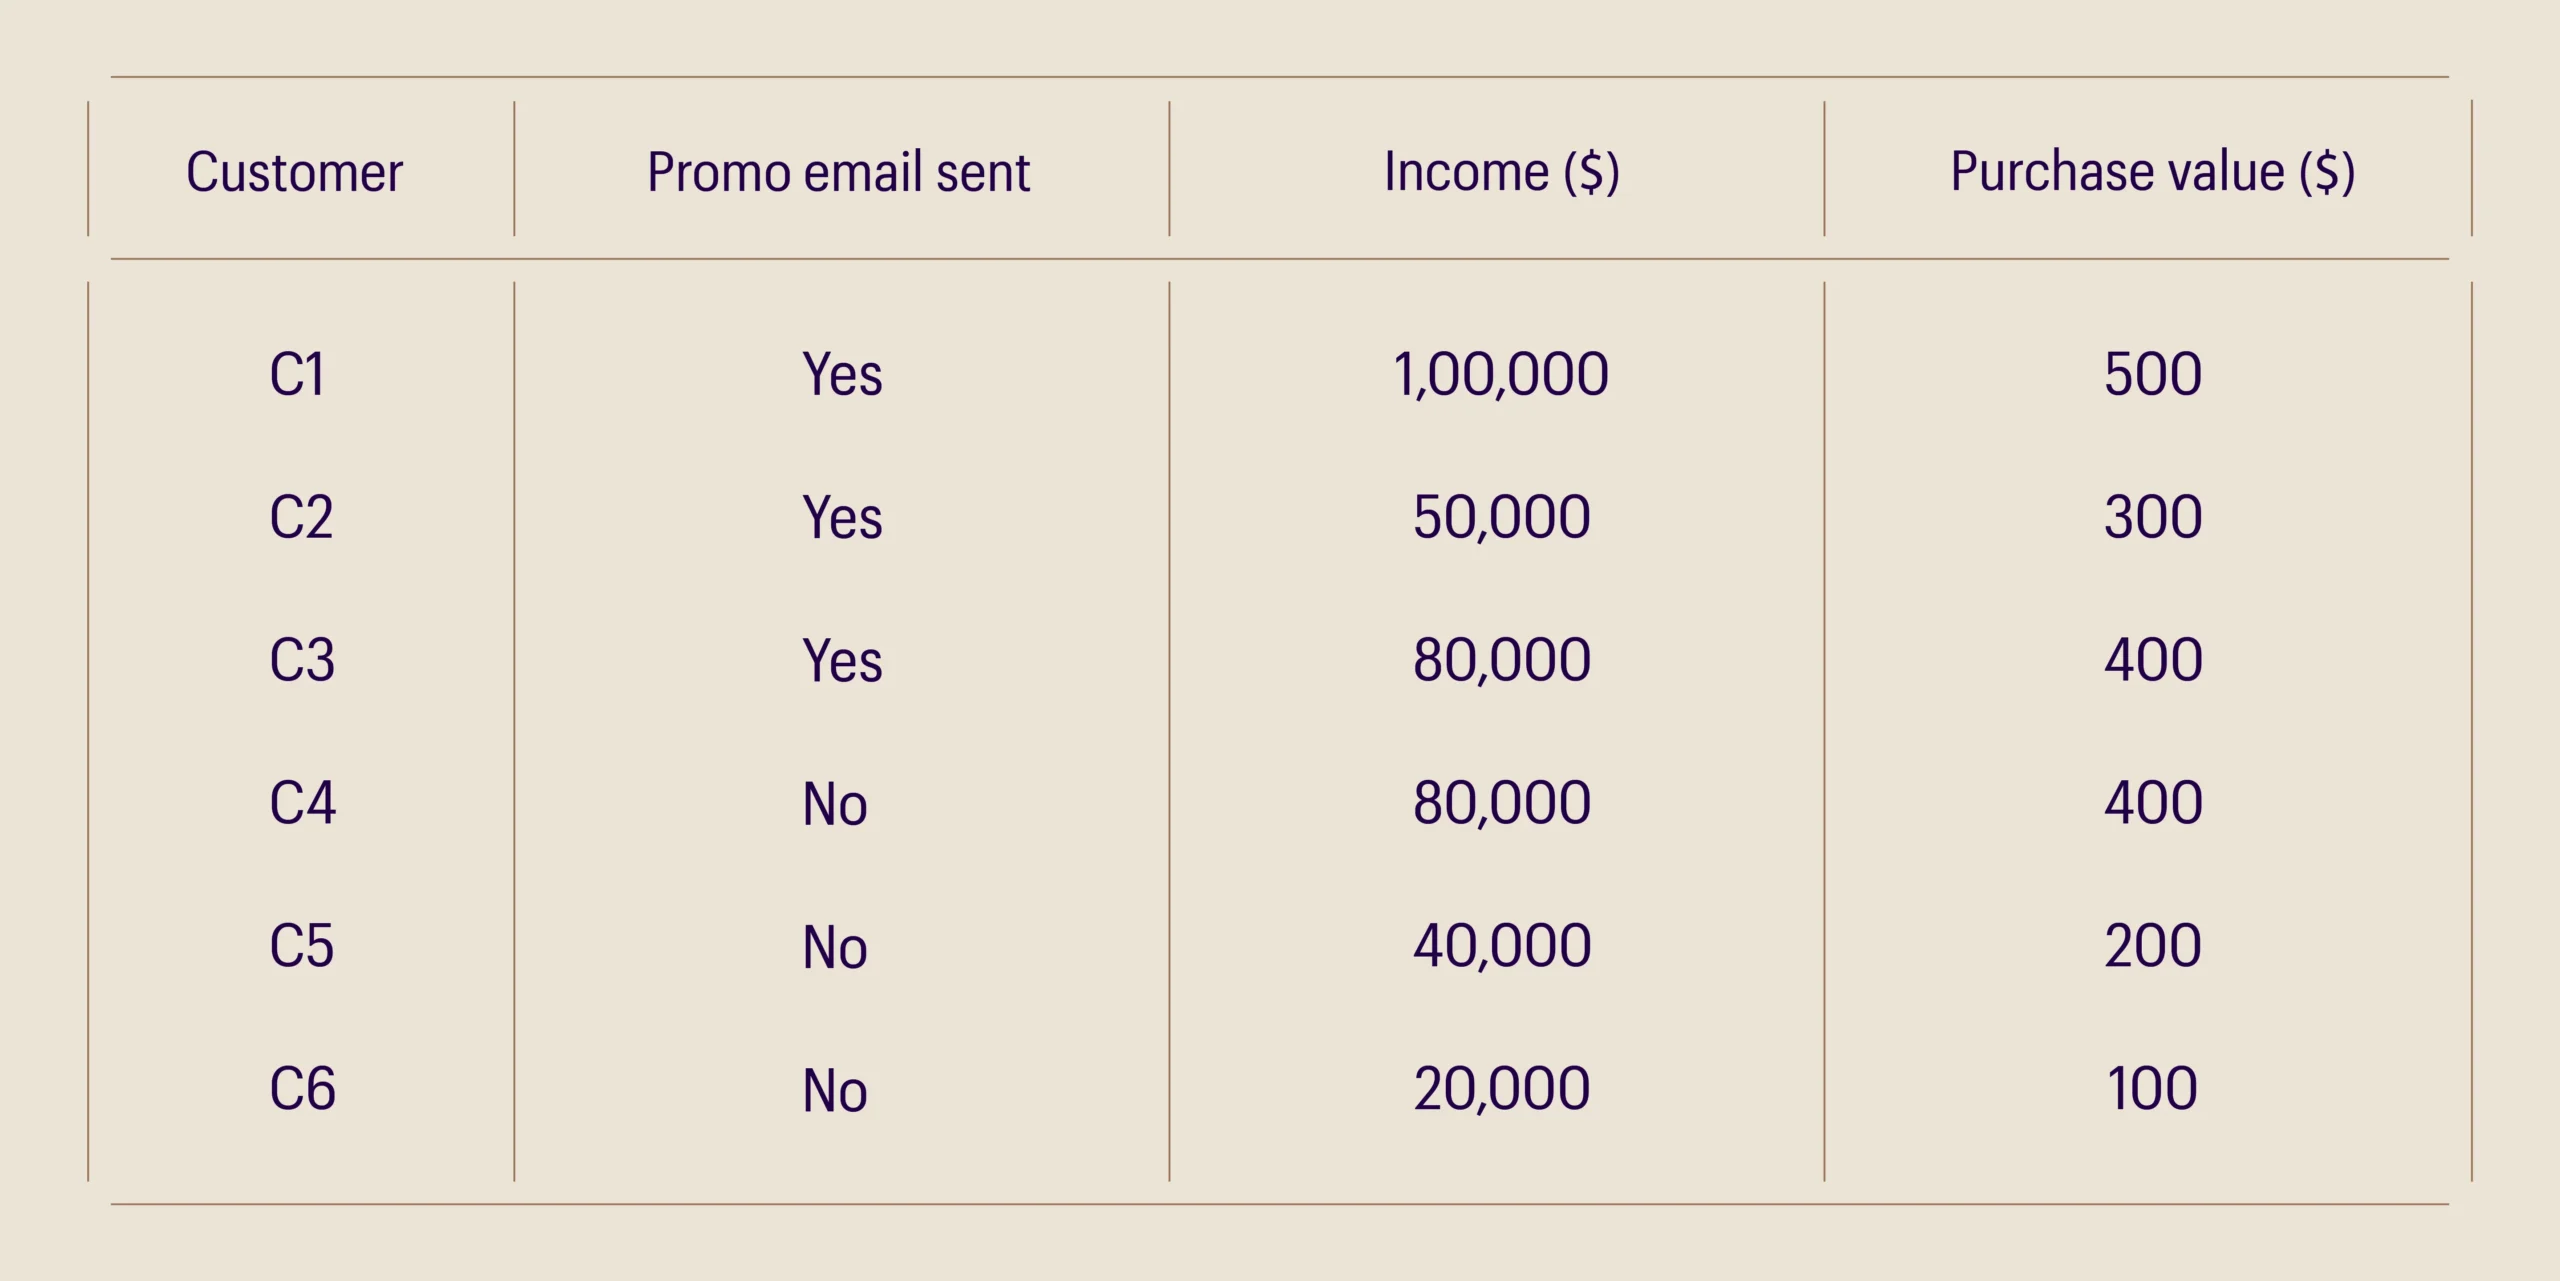
Table 2: Customer purchase data
The mean purchase values of the 2 groups of customers are $400 and $233, respectively. At first glance, it looks as if sending a promo email caused $167 incremental purchases. However, notice that the income of customers who received promo emails is higher than that of customers who did not. The effect of promo emails on purchase value is confounded by income in this example.
To estimate the true causal effect, we need to match customers who received emails with customers in the same income level who did not receive emails. Table 3 is created to estimate the true causal effect of promo emails by conditioning for income. The conclusion is that promo emails indeed lead to higher purchases, but the incremental value of those induced purchases is much smaller—at $67.
While we have come up with a simplistic example here, in the real world, there are multiple confounders, and hence, more sophisticated matching algorithms are used.
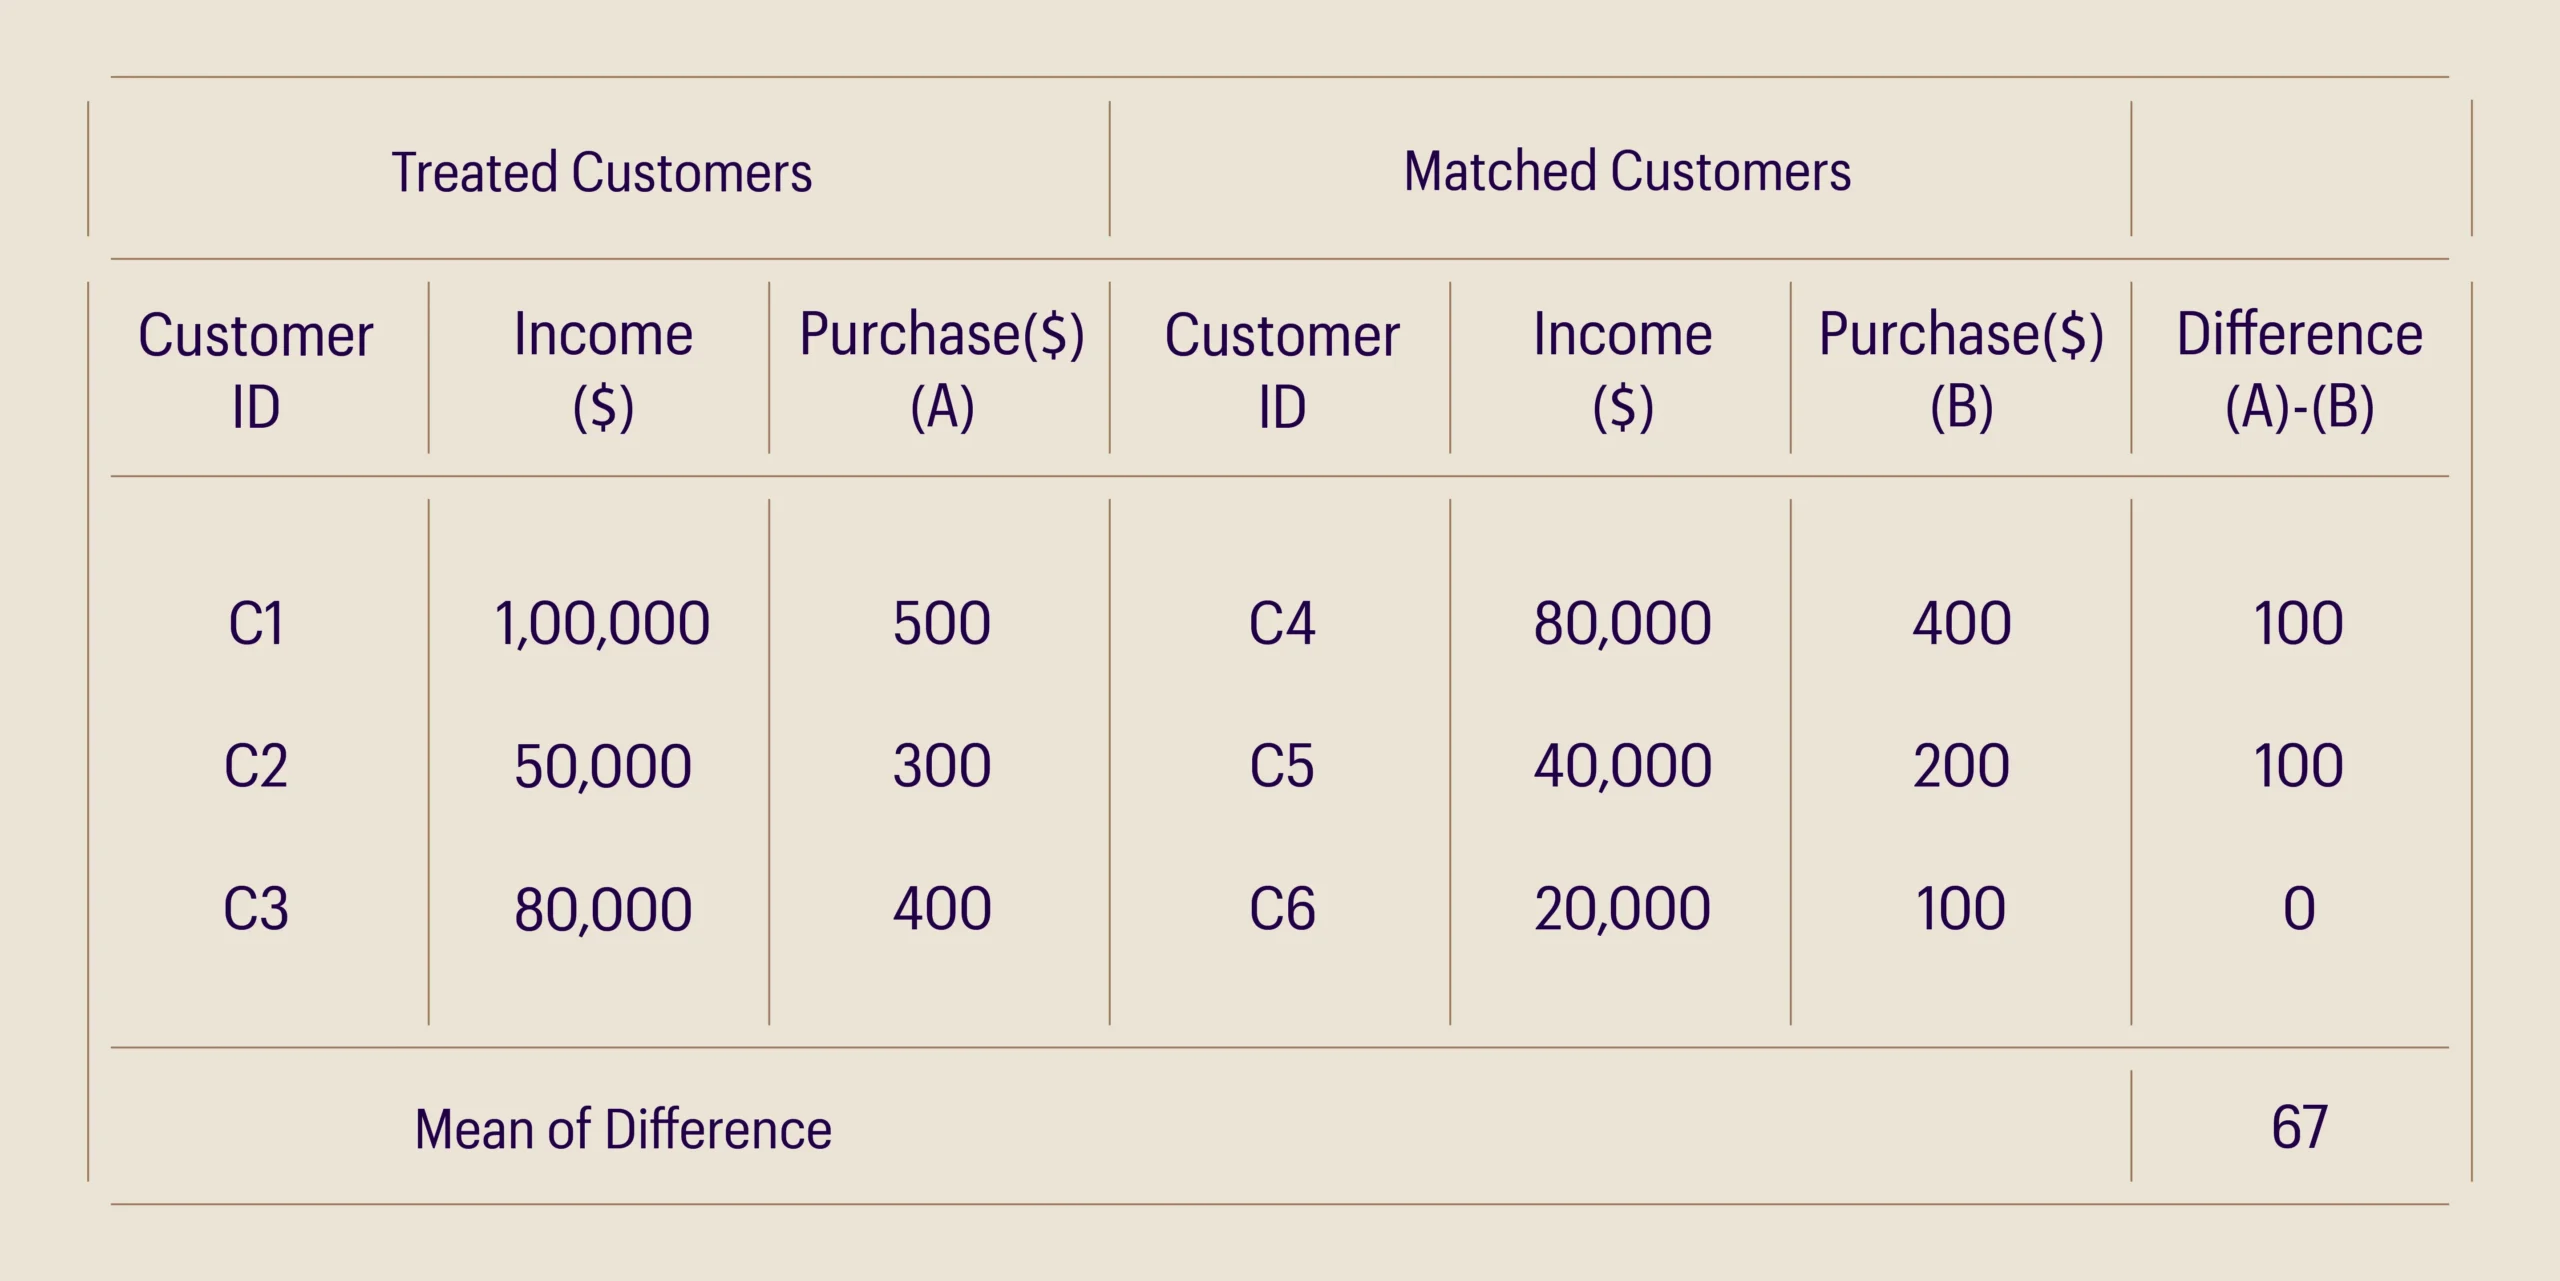
Table 3: Matching to estimate causal effect
Causal Inference Methods: Highly Significant for Data Scientists and Businesses
The adoption of causal inference methods is increasing wherever the objective is to answer why something is happening. They are an additional toolkit for data scientists for use cases where causality is more important than prediction. We have seen successful application of causal inference in answering questions such as ‘What causes customers to become more/less loyal’, ‘What factors cause higher adoption rate for a technology product’.
Tech giants [1] [2] are leading the research in causal inference to extend the capabilities of the technology. Developments in causal machine learning, where the aim is to build causality into the Machine learning process, are extremely promising. There are several useful open source libraries for causal modeling that make it relatively simple to get started with these approaches.
References:
- “Introduction.” Introduction · GitBook. Accessed March 15, 2023. https://causalinference.gitlab.io/kdd-tutorial/intro.html.
- “Directed Acyclic Graphs (DAGs) and Regression for Causal Inference.” UC Davis Health. Accessed March 15, 2023. https://health.ucdavis.edu/media-resources/ctsc/documents/pdfs/directed-acyclic-graphs20220209.pdf.
- “Outline – University of Wisconsin–Madison.” University of Wisconsin. Accessed March 15, 2023. https://pages.stat.wisc.edu/~ane/st572/notes/lec18.pdf.
Glossary:
- SHAP: SHapley Additive exPlanations
- LIME: Local Interpretable Model Agnostic Explanation
Bibliography:
[1] “Causality and Machine Learning.” Microsoft Research, 2023. https://www.microsoft.com/en-us/research/group/causal-inference/
[2] Harinen, Totte, and Bonnie Li. “Using Causal Inference to Improve the Uber User Experience.” Uber Blog, June 19, 2019. https://www.uber.com/en-IN/blog/causal-inference-at-uber/.

Sourav Banerjee
Head of R&D and PlatformSourav is a seasoned analytics professional with more than 17 years of experience building data products across different domains like customer service automation, B2B lead generation, CLTV, and more. At MathCo, he leads the Innovation practice, which focuses on identifying emerging technologies in AI, incubating new analytics solutions, and conducting applied research in technologies like Generative AI, time series forecasting, computer vision, knowledge graph, and much more. In his free time, he likes to read different types of blogs and books.