The shift toward data-centric operations has elevated dashboards into critical tools for insight and analysis. Yet, while dashboards excel at displaying information, they often fall short in delivering the full narrative behind the numbers. Business users and analysts still spend hours manually extracting insights, capturing screenshots, and building presentations that communicate the story to stakeholders—an effort that is repetitive, time-consuming, and difficult to scale.
NucliOS addresses this gap with AI Stories—a storytelling layer that transforms dashboards and external data into compelling, context-rich presentation decks. By combining visual analytics with natural language capabilities, AI Stories helps users generate clear, customized, and shareable narratives in minutes. Whether the insight lives on the dashboard, in spreadsheets, or as domain context known only to the team, AI Stories brings it all together to tell a complete and coherent story.
AI Stories empowers users to tell richer, more complete data narratives by going beyond standard dashboards. Not all insights live in charts—some reside in backend systems, spreadsheets, or business updates. With Ask NucliOS, users can seamlessly bring in this context, like upcoming pricing changes or backend improvements, and embed them directly into their story.
Whether it’s dashboard data, structured files, or external databases, AI Stories helps unify it all. Ask NucliOS can even generate summaries or visuals from the combined sources—making it easy to deliver clear, presentation-ready insights.
By combining powerful, interactive visualizations with the intelligence of Ask NucliOS— our very own AI Assistant Platform, driven by advanced Large Language Models (LLMs)—AI Stories helps you generate compelling, tailored narratives instantly. No more repetitive work. Just smart, seamless data storytelling.
From Dashboard and Data Sources to Deck—In Minutes, Not Hours
Despite the availability of sophisticated dashboard tools, the final mile of data communication remains painfully manual. Analysts and business users often spend hours:
- Copying charts and tables into PowerPoint
- Summarizing key findings
- Formatting decks to align with brand guidelines
- Customizing reports for different regions or leadership levels
This not only slows down decision-making but also reduces consistency and clarity across presentations.
With AI Stories, you can bring dashboards and data from other sources—to life, transforming raw insights into structured, shareable, and presentation-ready stories in a matter of minutes. It’s not just faster; it’s fundamentally smarter.
How It Works: A Seamless Storytelling Workflow
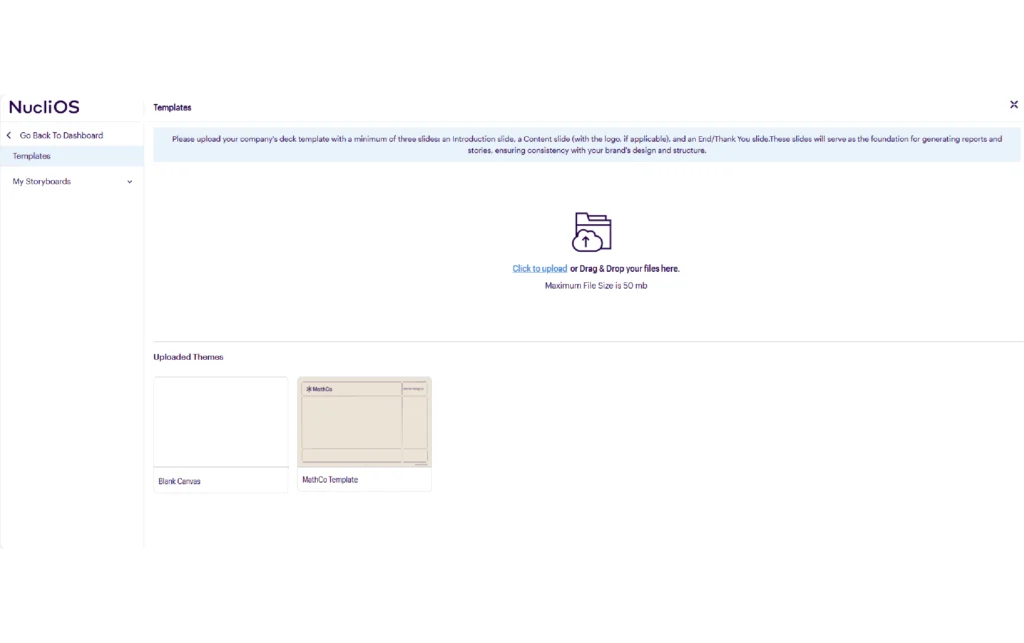
- Create a new story by applying pre-approved templates—or uploading your own—so every deck stays on-brand.
- Drag & Drop Visuals: Select key components—KPIs, graphs, tables—and place them directly into your story canvas.
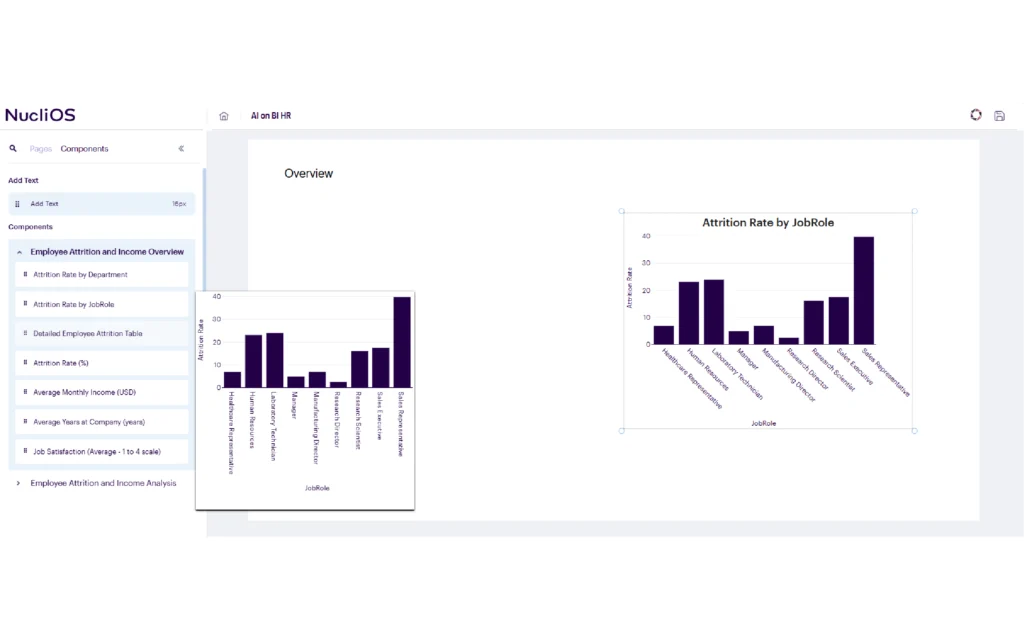
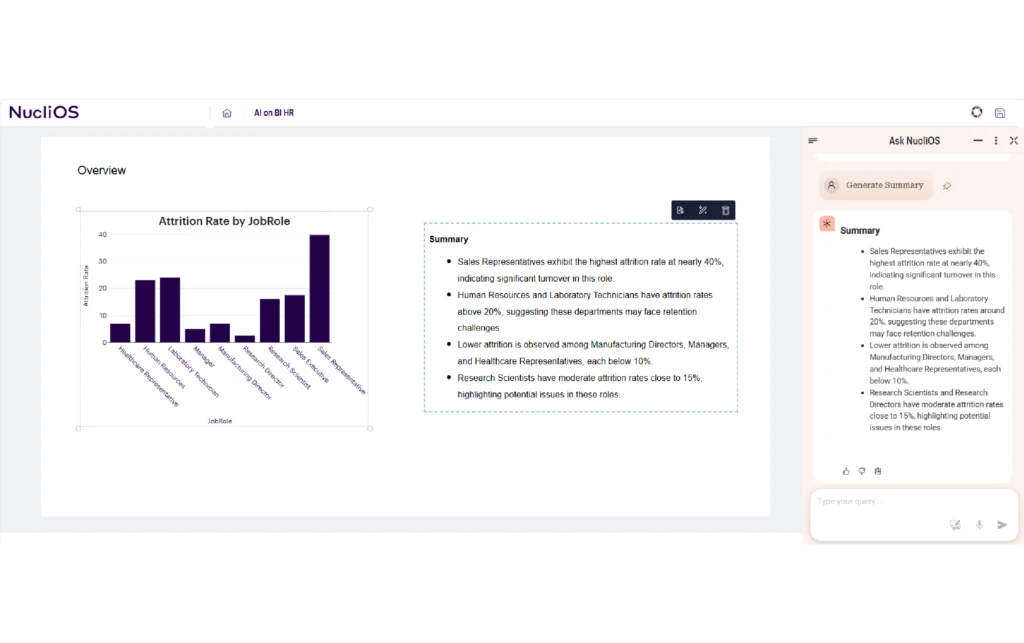
- Leverage Ask NucliOS to auto-generate summaries for visuals.
- Use Ask NucliOS to gather additional insights beyond what’s available in the dashboard and seamlessly enhance your story by copying the AI-generated graphs directly onto the canvas.
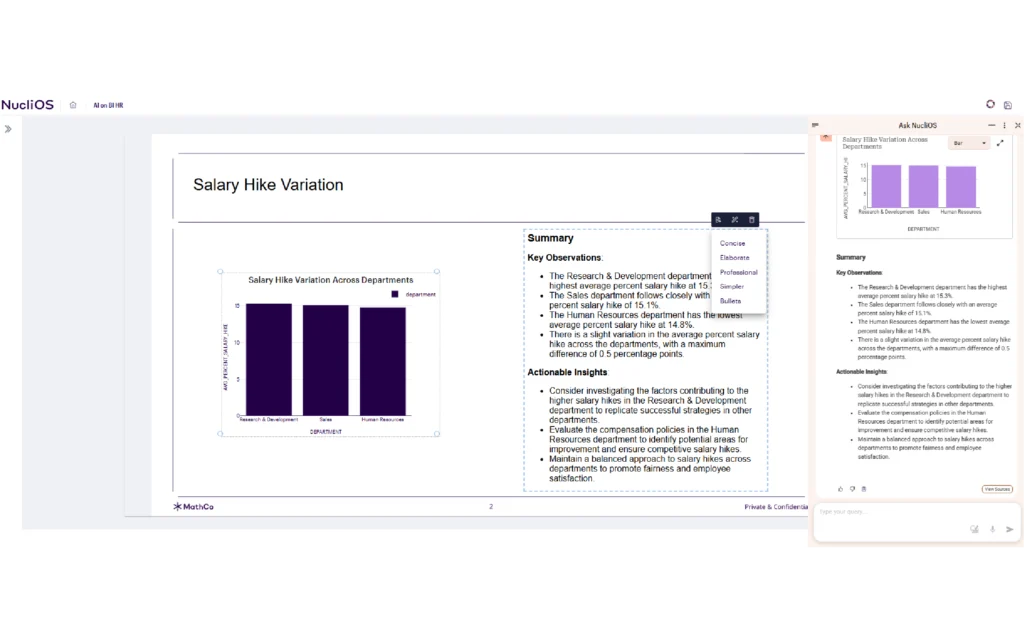
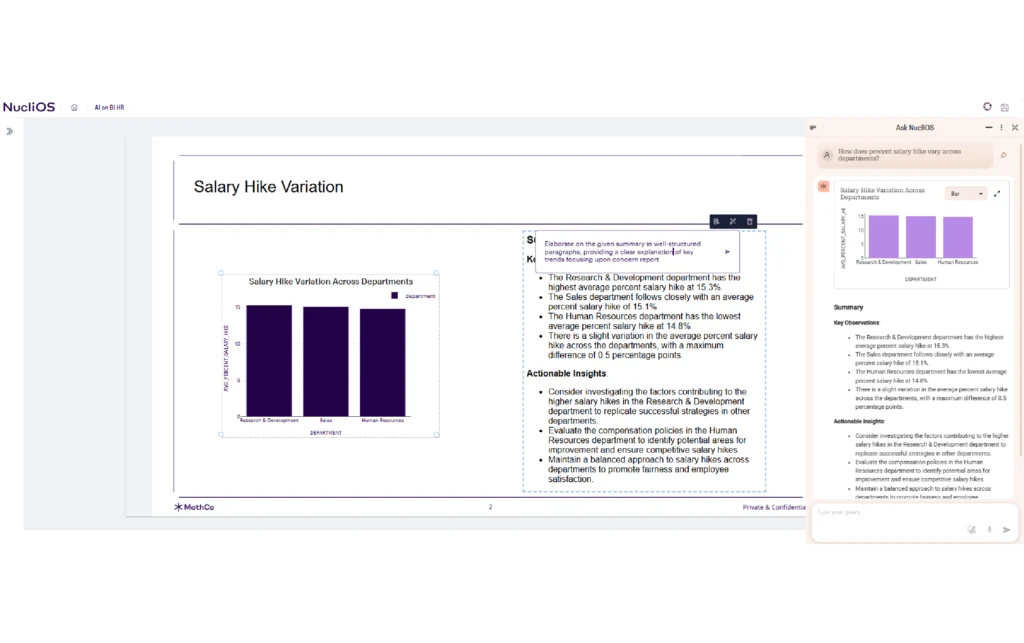
- Change the tonality of the summary generated by selecting from readily available options or add your own prompt to customize them.
- Choose among live-linked decks (editable), read only snapshots based on your reporting need, and you can even download PPT.
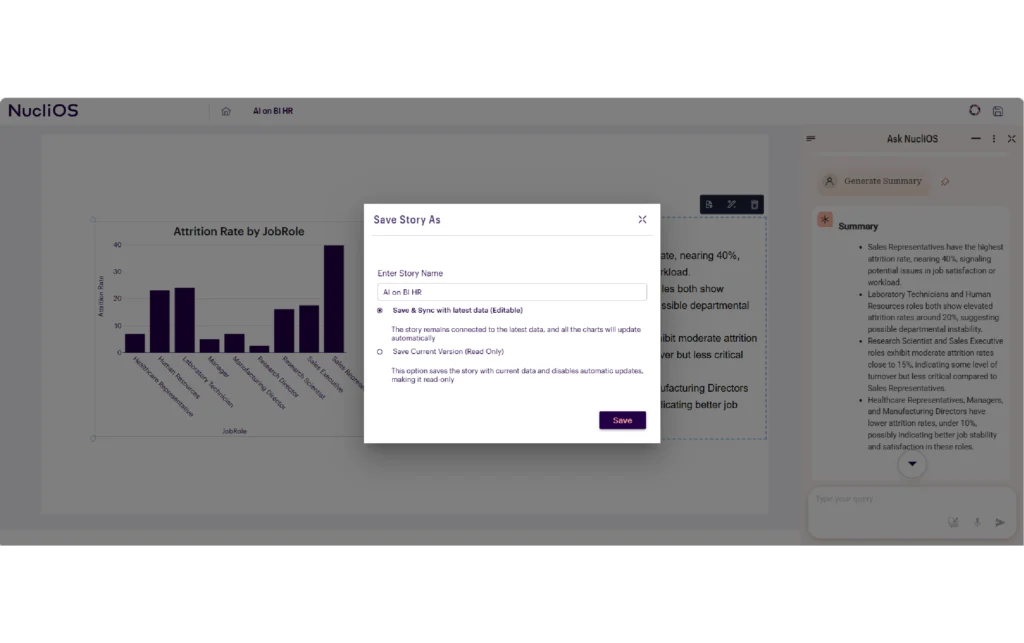
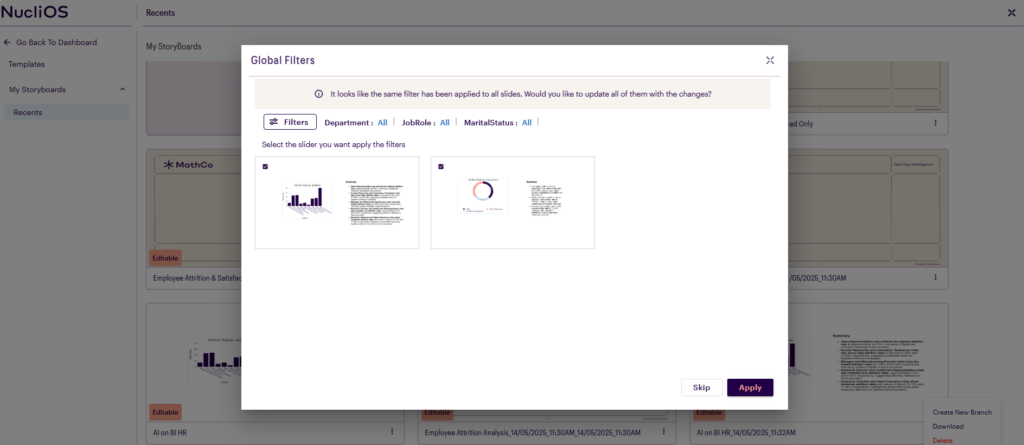
- Easily clone existing decks using the “Create new branch“ option to reuse layouts, update content or visuals, and apply “Global Filters” across slides with a single sync prompt to create regional or time-based variants in seconds.
What previously took hours of coordination, formatting, and rewriting now takes a fraction of the time—with more accuracy and a clear narrative structure.
Beyond Dashboard and Data Sources
Dashboards are excellent for presenting data—but they don’t always explain why the data looks the way it does. Business performance is shaped by many factors beyond what’s visualized: operational issues, external events, campaign shifts, or even human decisions. AI Stories helps bring all of this into a single, shareable narrative.
A Campaign QBR Example
Imagine a marketing analyst preparing a Quarterly Business Review (QBR) for a recently launched product. The objective is to share what happened, why it happened, and what it means for future decisions.
- Step 1: Start with Dashboard Insights
The analyst opens a regional sales dashboard and selects a QBR presentation template. Key visualizations—such as sales growth, conversion rates, and regional performance—are dragged into the canvas to form the core of the presentation. - Step 2: Add Context from Outside the Dashboard
Midway through the quarter, the marketing team changed their media mix, a PR event spiked traffic, and a backend outage briefly impacted conversions. These are crucial to understanding campaign performance, yet they’re not captured in the dashboard. - Step 3: Use Ask NucliOS to Fill the Gaps
The analyst prompts: “Summarize the Q2 campaign performance, including the April PR event and the backend outage’s impact on conversions.”
Ask NucliOS integrates both on-dashboard and external inputs to generate a clear, context-rich summary. - Step 4: Generate Comparisons Quickly
For Q3 comparisons, the analyst clones the Q2 deck, applies a new filter, and Ask NucliOS updates both visuals and narratives automatically. Two stakeholder-ready presentations—tailored for executive review—are created in minutes. - Step 5: Save Time and Improve Clarity
The final decks are not only faster to produce—they’re consistent, contextual, and aligned with business objectives. No formatting headaches, no redundant manual effort.
Why It Matters for Business?
AI Stories is not just a workflow enhancement—it’s a strategic capability. It empowers teams across the organization to tell better stories with their data and make insights more accessible.
What You’ll Achieve with AI Stories?
- Unify Insights: Combine visualizations with external business context for a complete view.
- Save Time: Eliminate repetitive manual tasks and focus on insight-driven communication.
- Improve Clarity: Add narrative depth and explain the “why” behind the “what.”
- Scale Easily: Generate variants of the same deck by audience, region, or timeframe with a few clicks.
- Empower Teams: Enable non-technical users to build, edit, and share compelling data stories independently.
The Future of Data Storytelling Is Smarter
In today’s fast-paced environment, businesses don’t just need more dashboards—they need better communication around data. AI Stories brings together analytics, automation, and storytelling to help teams move faster, think clearer, and deliver more impact.
Because in a world full of dashboards, it’s the story that sets your data apart.
Learn more about NucliOs here.
